%201.avif)
.svg)
How does IT help desk resolution time affect employee satisfaction?

Listen to this blog as a podcast

.avif)
Faster resolution makes users happier, but the relationship is more specific than that. According to Fixify's 2026 IT Help Desk Benchmark Report, based on 50,000+ tickets across 30+ organizations over 14 months, there's a resolution window where IT support has an outsized impact on user satisfaction: 15 minutes to 4 hours. Hit that window and 93–97% of frustrated users leave more satisfied than they arrived. Miss it, and your odds drop steadily with only 68% leaving more satisfied when tickets take 3 days or more to be resolved.
A CIO once told me: "If people are happy, no one will look at the numbers. And if people are unhappy, no numbers will save me." The benchmark data backs him up. But it also reveals exactly where the window is and which ticket types matter most.
Most users aren't frustrated — but when they are, resolution speed is what turns it around
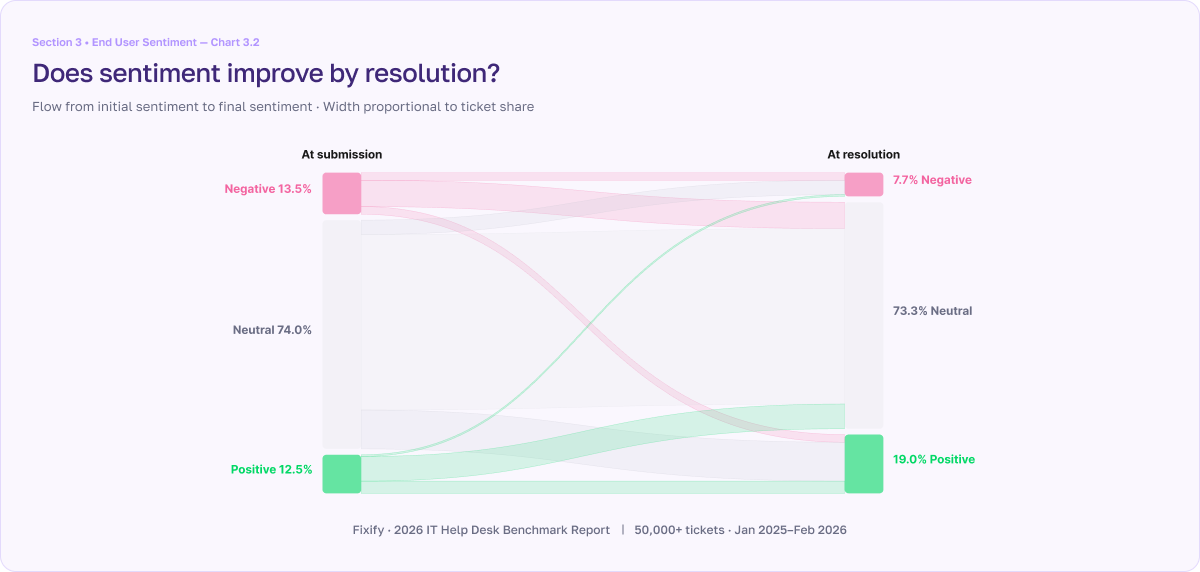
82% of tickets arrive with neutral sentiment. Among the 8.7% that arrive frustrated, 81.6% leave satisfied by resolution.
The vast majority of help desk tickets carry no emotional charge. Employees submit a request, describe their issue, and move on. Only about 1 in 11 tickets arrives with negative sentiment. That's the good news.
The better news: frustrated users are highly convertible. Of the tickets that start negative, 81.6% improve by the time the ticket is resolved — 63.1% move to neutral and 18.4% become actively positive. Only 18.4% of frustrated users are still negative at close.
What drives that conversion? Resolution speed. First response times are essentially identical across sentiment groups — all around 5 minutes. The difference isn't in how fast you pick up the ticket. It's in how fast you close it.
The sweet spot is 15 minutes to 4 hours
Tickets resolved in this window convert 93–97% of frustrated users to positive or neutral ones. In the 15-minute-to-1-hour band, 37% become actively positive.
The benchmark data breaks down sentiment improvement rates by resolution time, and the pattern is clear:
- 15 minutes to 1 hour: 97% of frustrated users improve. 37% become actively positive — not just neutral, but genuinely appreciative.
- 1 to 4 hours: 93% improve. 26% become actively positive.
- 4 to 24 hours: 88% improve. The conversion is still strong, but the share of actively positive users starts to fade.
- After 3 days: 68% improve. A third of frustrated users stay frustrated, regardless of the resolution quality.
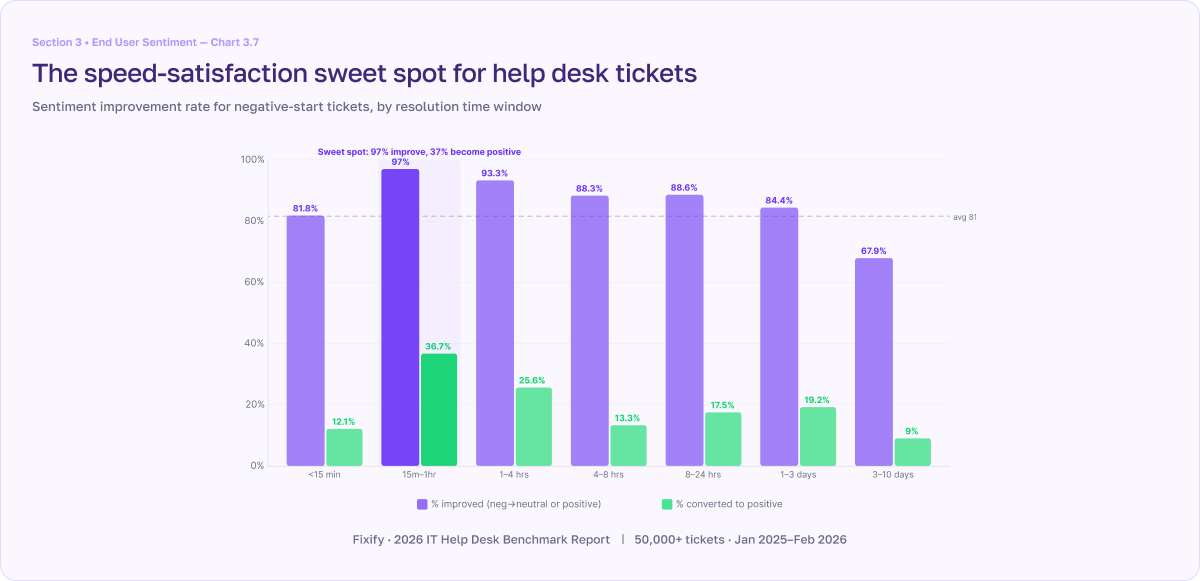
The under-15-minute band is interesting: it converts at only 82%, lower than the 15-minute-to-4-hour sweet spot. That's likely because very fast closures sometimes reflect auto-closures or triage actions rather than genuine resolution. What frustrated users value most isn't raw speed. It's attentive speed: a meaningful resolution delivered quickly.
One other pattern worth noting: the number of back-and-forth exchanges between the user and the IT team matters independently of duration. More round-trips correlate with lower satisfaction. A resolution that takes 2 hours with one exchange lands better than a resolution that takes 2 hours with six.
Hardware and connectivity are where this matters most
One in four hardware tickets arrives frustrated — 3x the average. Yet both hardware and connectivity convert at 80%+ when resolved.
Not all ticket types carry the same emotional weight. Hardware tickets arrive with 25% negative sentiment. Connectivity is close behind at 22%. Every other category falls well below these two — identity and access management (IAM) is at 9.7%, Collaboration at 6.8%, and Software & Applications at 6.1%.
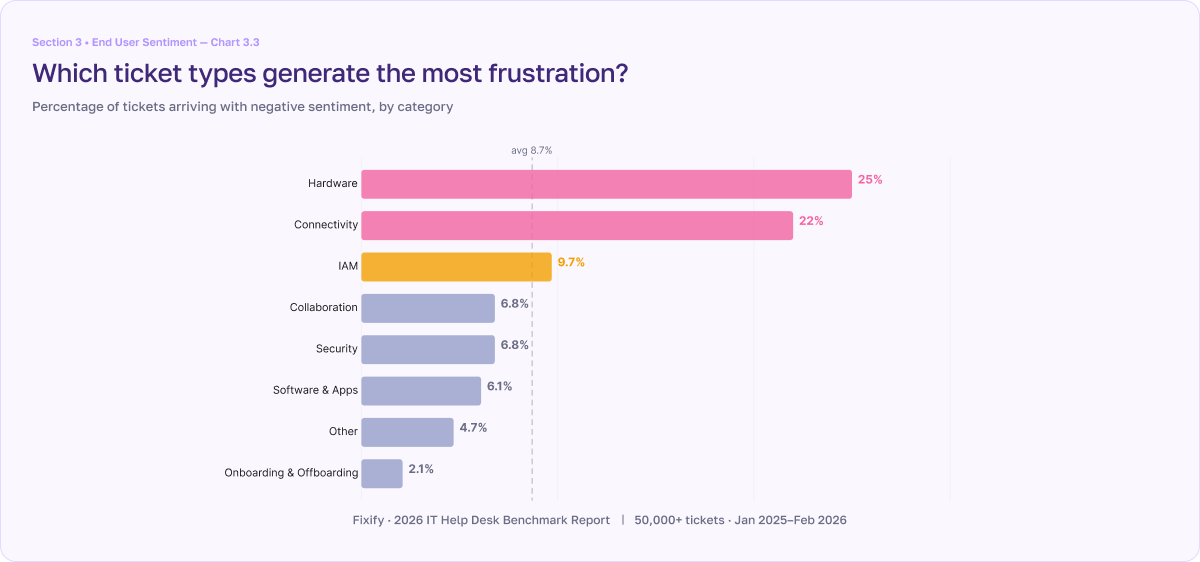
The reason maps to something fundamental about how people experience work: what drives satisfaction isn't perks or recognition, it's the ability to make daily progress on work that matters. When your laptop won't boot or your VPN drops, progress stops completely. That's why these categories arrive with outsized frustration. And it's why a ticket with the word "again" in it — signaling a repeat failure — is almost always negative.
But here's the thing: hardware and connectivity both convert at 80%+ when the issue gets resolved. The frustration is acute but temporary. Fast-tracking these categories is the single highest-leverage move for improving your overall satisfaction numbers.
Resolution converts across every category
Every ticket category shows an 80%+ improvement rate for negative-start tickets.
This isn't just a hardware and connectivity story. The sentiment improvement rate for negative-start tickets is remarkably consistent across all categories:
- Security leads at 88.5%.
- Collaboration converts at 84%.
- IAM and Connectivity both sit at 81.7%.
- Hardware at 80.4%.
- Software & Applications, the highest-volume category in the dataset at 38.2% of all tickets, converts at 80.1%.
The consistency is the point. Resolution works. Regardless of what went wrong, fixing it shifts how the user feels. The variable isn't the category, it's the speed.
What this means for SLA design
Resolution speed is one of the easiest operational metrics to track. It's also a satisfaction lever, and this data gives you a specific target to build around.
- For high-frustration categories like hardware and connectivity, consider internal SLAs pegged to the 4-hour mark. That keeps you inside the window where 88%+ of frustrated users convert.
- For the 15-minute-to-1-hour band, where conversion peaks at 97%, identity-related tickets like account lockouts and MFA issues are the best candidates. They're high-frustration, high-volume, and structurally fast to resolve with the right tooling.
- For tickets that will inevitably stretch past 4 hours like onboarding workflows, complex integrations, and vendor-dependent issues, the data still offers a practical lever: periodic updates. Keeping the user informed about what's happening and what comes next can bend the satisfaction curve even when resolution takes days.
And if you're only tracking one new metric after reading this, make it your sentiment improvement rate. The benchmark is 81.6%. If you're below that, the most likely causes are slow resolution times or issues that aren't fully resolved on first contact. Both are fixable — but you have to measure how your users feel to know whether you're making progress.
For the full sentiment and resolution data by category, time window, and company size, download Fixify's 2026 IT Help Desk Benchmark Report at fixify.com/it-help-desk-benchmark-report-2026.
Related articles
Fixify Service Catalog: The heat map that shows what IT really does all day


A founder’s take: Navigating building products in the new generative AI world


Is your IT infrastructure showing its age? Here’s how AI + people can help
Stay in the loop

Sign up to get notified about our latest news and blogs