Benchmark your help desk

Give us 90 days of ticket data.
Get a customized report.

Upload your ticket data

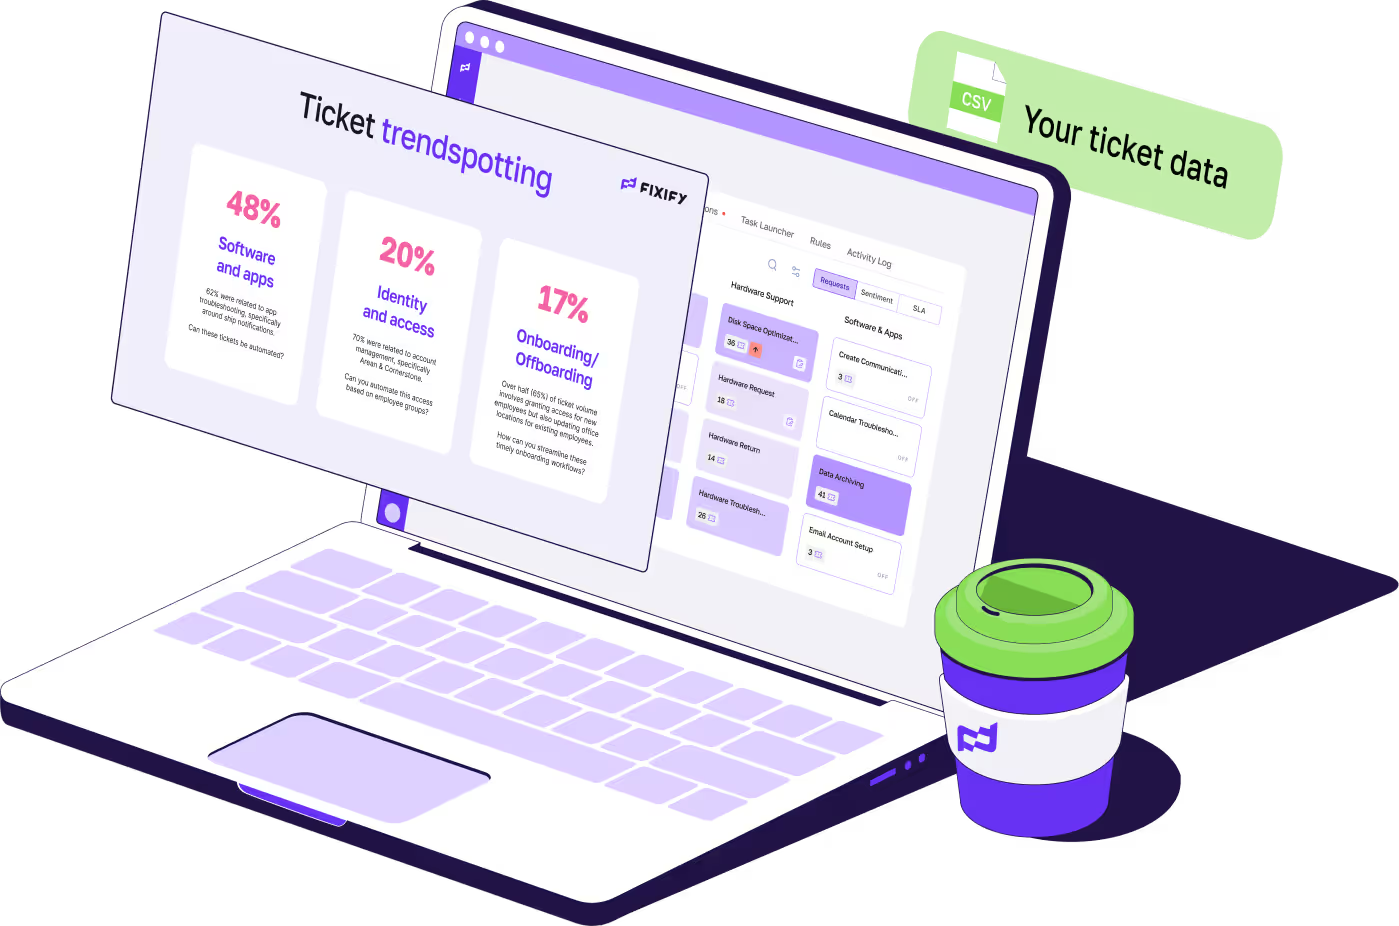
Laptop screen displaying ticket trendspotting data with categories Software and apps, Identity and access, and Onboarding/Offboarding, alongside a coffee cup and a floating label indicating 'Your ticket data' with a CSV file icon.

2M+ tickets reviewed

How the
Ticket Snapshot works

01

Prep your file

Format your CSV using these instructions

02

Upload ticket data

Use our secure file upload to share your CSV file

03

Review your results

Explore your personalized report & Loom video

AICPA SOC 2 certification badge for Service Organizations.

Ensuring trust and security year-round

Learn more
Learn more

Your report will include

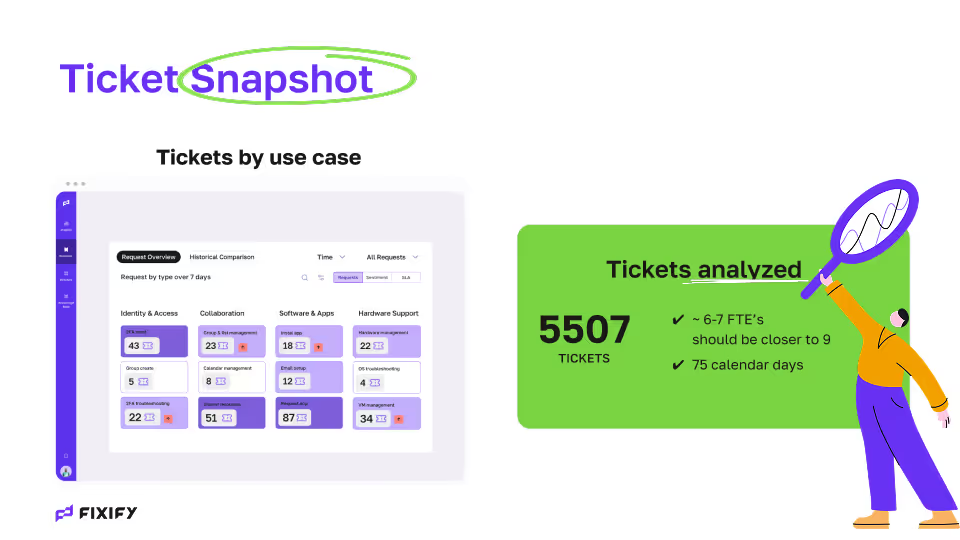
Where your help desk spends time

  • % of tickets across 50+ use cases

  • % of tickets by category

  • % of tickets by arrival time

  • Top apps generating tickets

Dashboard titled Ticket Snapshot showing ticket counts by use case categories and a summary of 5507 tickets analyzed with notes on FTEs and calendar days.

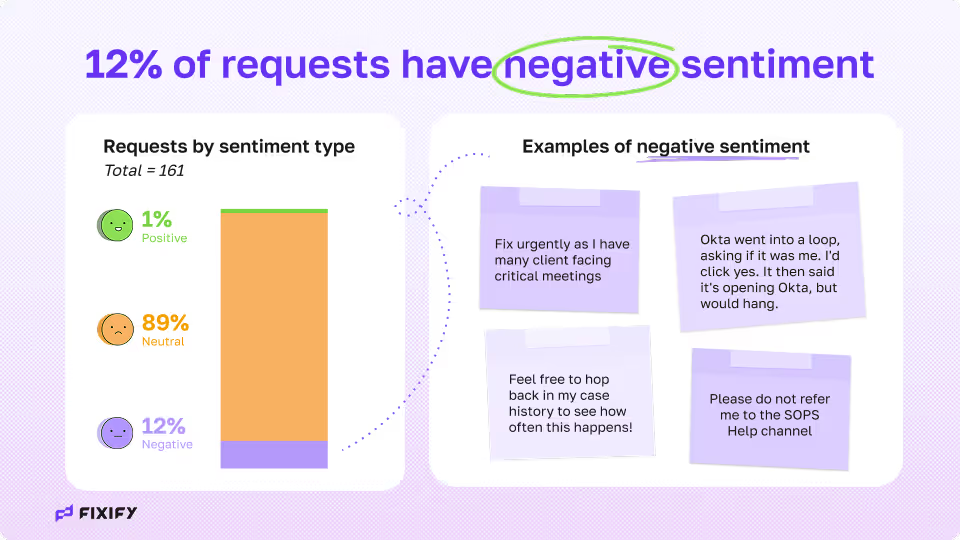
How users feel about the service

  • User sentiment heat map

  • Sentiment insights

Chart showing 12% of 161 requests have negative sentiment, 1% positive, and 89% neutral, with examples of negative comments.

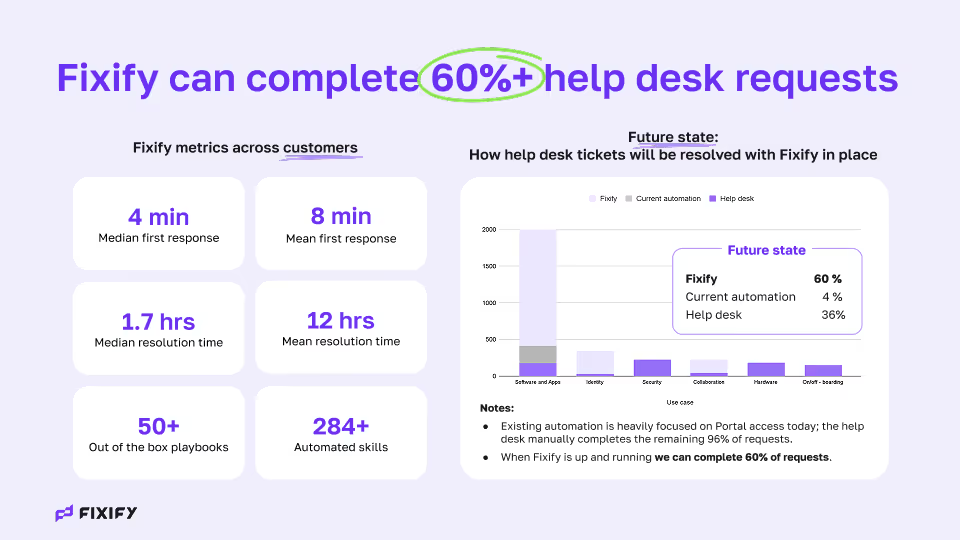
Your key stats vs. benchmarks

  • Cost per ticket ($ est.)

  • Average time to 1st response

  • Average wait time

  • Average resolution time

Infographic showing Fixify key stats: 4 min median first response, 8 min mean first response, 1.7 hrs median resolution time, 12 hrs mean resolution time, 50+ playbooks, 284+ automated skills, and a bar chart indicating Fixify can complete 60% of help desk requests with current automation at 4% and help desk at 36%.

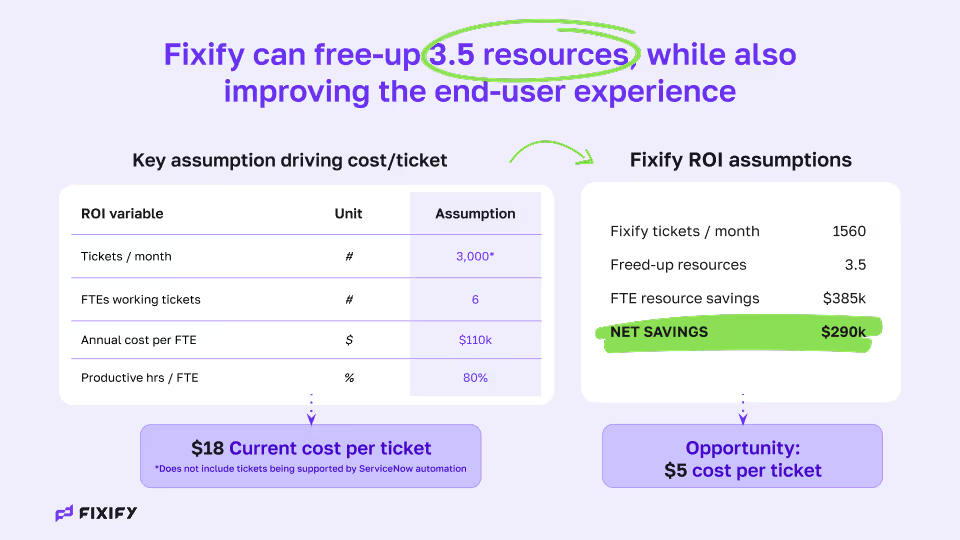
Top opportunities for improvement

  • Automation opportunities

  • Help desk capacity

  • Process improvements

Fixify can free-up 3.5 resources while improving end-user experience; table shows key assumptions driving cost per ticket with 3,000 tickets/month and 6 FTEs; ROI assumptions show 1,560 tickets/month, 3.5 freed-up resources, $385k FTE savings, and $290k net savings.

FAQ

A group of people sitting around a table with laptops.
01
Contact details
02
Upload your data

Let's get started