%201.avif)
.svg)
What are the most common IT help desk tickets?


Listen to this blog as a podcast

.avif)
It's not password resets. It's not hardware failures. It's not "my laptop is slow." The most common IT help desk ticket is an app assignment request — an employee asking for access to a software application. According to Fixify's 2026 IT Help Desk Benchmark Report, based on 50,000+ tickets across 30+ organizations over 14 months, app assignment accounts for 28.1% of all help desk tickets. That's more than 1 in 4, and more than 4x the volume of the next most common use case.
One use case dominates everything else
App assignment makes up 28.1% of all tickets — more than 4x the second-place use case.
The gap between app assignment and everything else on the list is striking. Permissions management comes in second at 6.2%. Employee offboarding is third at 5.8%. Employee onboarding sits at 5.7%, and login troubleshooting at 4.9%. After that, the numbers taper steadily into single digits.
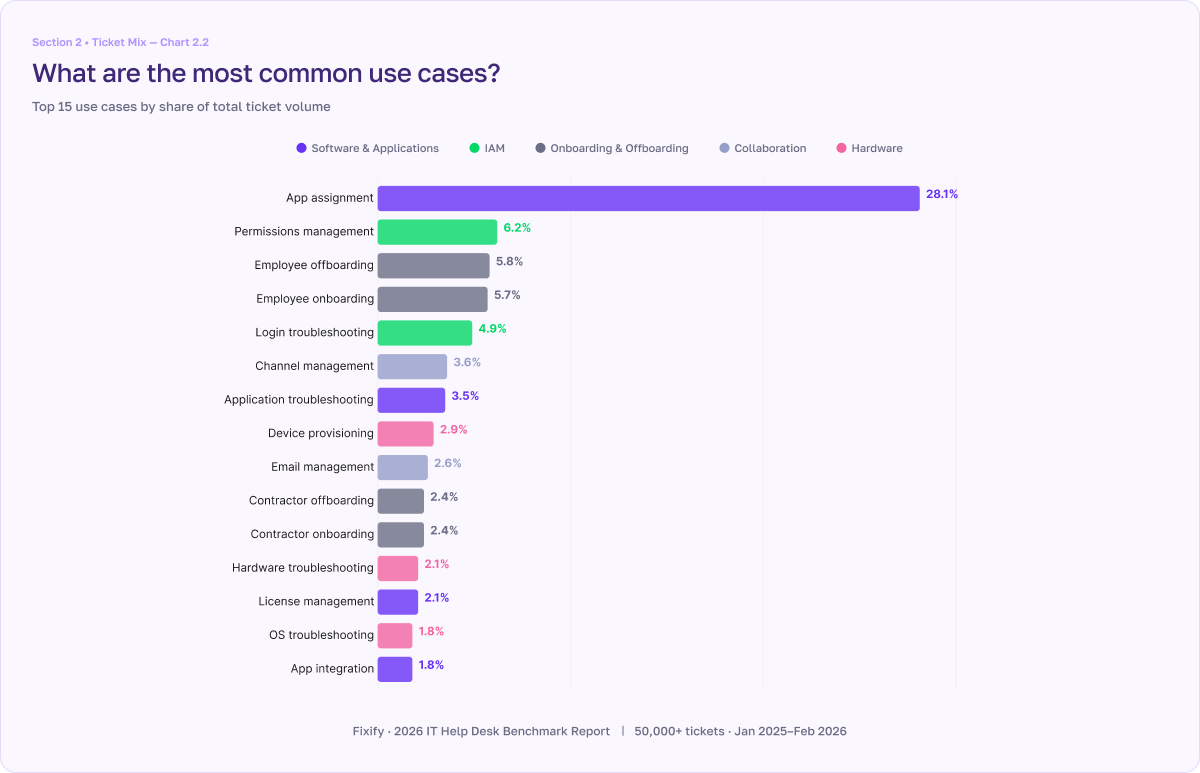
The top three use cases — app assignment, permissions management, and employee offboarding — account for 40% of all tickets combined. The remaining 40+ use cases tracked in the dataset share the other 60%. That kind of concentration means that if you can streamline your top two or three use cases, you move the needle for the entire help desk.
Employee lifecycle management deserves a separate callout: when you combine employee onboarding, employee offboarding, contractor onboarding, and contractor offboarding, those four use cases account for 16% of all tickets. For growth-stage companies that are actively hiring, that share is even larger.
Three categories account for more than 70% of volume
Software & Applications (38.2%), Onboarding & Offboarding (16.6%), and IAM (15.9%) dominate the ticket mix.
At the category level, the concentration is just as pronounced. Software & applications alone makes up more than a third of all tickets. Add onboarding & offboarding, and identity and access management (IAM), and you've covered more than 70%. The remaining six categories — collaboration (11.7%), hardware (8.4%), security (3.7%), connectivity (2.4%), and others — share less than 30%.
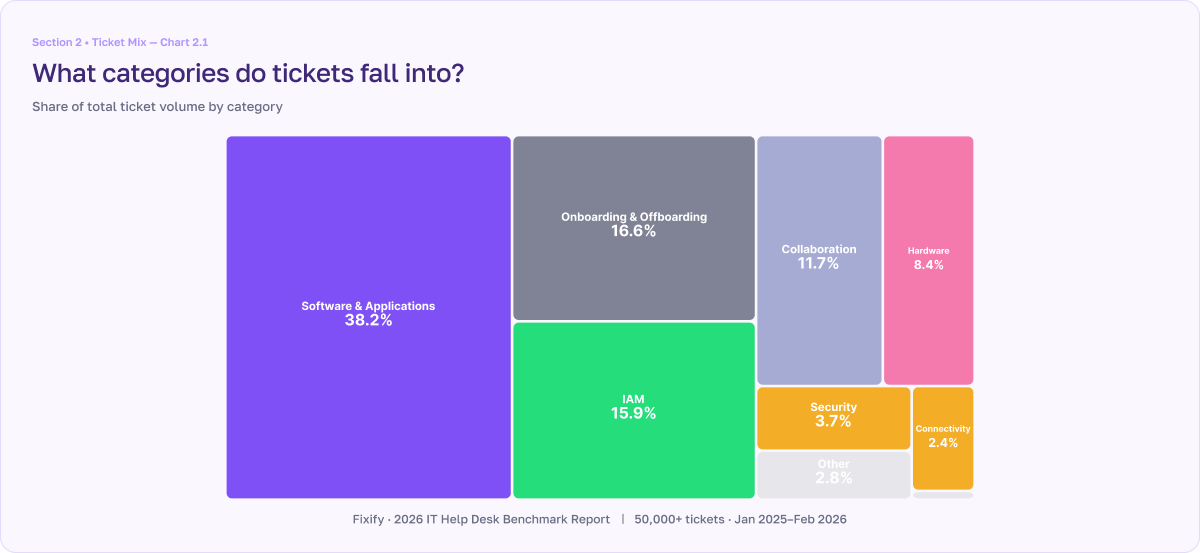
The dominance of software & applications reflects how much of modern work runs through SaaS tools. Every new hire needs access to dozens of applications. Every role change, project shift, or vendor addition generates access requests. And across the dataset, 483 distinct applications appeared in ticket data. That’s nearly 500 different tools generating support volume. That number grows with company size: organizations under 100 employees average about 5 distinct apps in their ticket data, while those with over 1,000 employees average roughly 63.
The ticket mix shifts as companies grow
Small companies are collaboration-heavy. Growth-stage companies see onboarding surge. At 500–999 employees, Software & Applications hits 57%.
The overall breakdown is a useful benchmark, but the mix changes substantially as organizations grow. Think of it less as a size difference and more as a developmental stage.
Small companies (under 100 employees) are still wiring up communication. Collaboration accounts for 22% of their tickets and security for 15%. They're building foundational infrastructure, and those issues flow directly to the help desk.
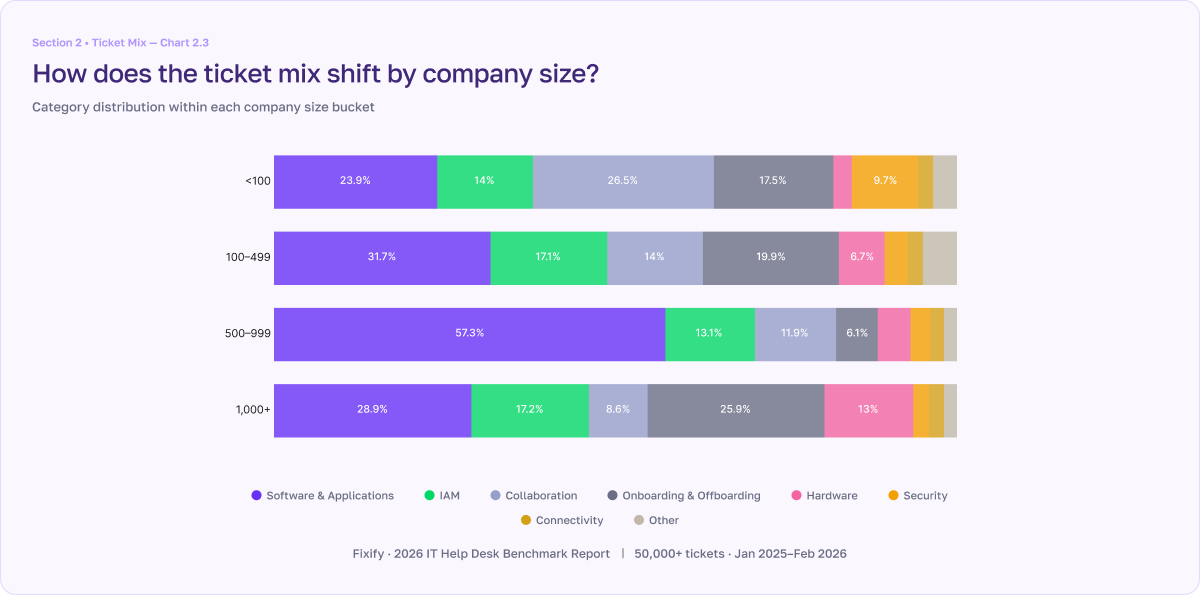
Growth-stage companies (100–499 employees) are adding people and software. Onboarding & offboarding surges to 20% of their ticket mix — every new hire needs to be provisioned, every departure unwound.
At 500–999 employees, software & applications peaks at 57.3%. App assignment alone accounts for roughly half of all tickets at this stage. These are SaaS-intensive environments where the sheer number of tools drives volume.
Enterprise organizations (1,000+) show the most diversified mix — onboarding & offboarding at 26%, hardware at 13%, IAM at 17%. Unlike earlier stages, no single category pulls away from the rest.
Why app assignment is so concentrated and what to do about it
The path to reducing app assignment volume isn't more IT staff, it's a documented app library with clear approval workflows.
App assignment dominates because SaaS environments are complex and constantly changing. But there's a subtlety that matters for anyone trying to reduce this volume: the bottleneck usually isn't the provisioning itself. It's knowing who approves access for each application.
For your CRM, it might be someone in sales ops. For a design tool, maybe the creative director. For a security application, the CISO's team. Every application in your environment has an approval chain — and for most organizations, that matrix isn't documented anywhere. IT absorbs the requests, then spends time chasing down the right approver before they can even begin provisioning.
The data suggests that the vast majority of app access requests could be automated. But automation can't work without that foundation. The first step isn't buying an automation tool. It's building a documented library of your SaaS applications with clear approval workflows for each one. That's the precondition — and it's the work that most directly converts app assignment volume from a help desk burden into a self-service workflow.
There's also a broader organizational conversation here. When a department decides to adopt a new tool — a third project management app, a new CRM — IT inherits the support burden. Having visibility into how much support each application actually generates gives IT leaders the data they need to have informed conversations about the true cost of SaaS sprawl.
Where to start
If app assignment is your top volume driver (and odds are it is), focus on two things:
- First, document your app approval matrix. For every application in your environment, identify who’s authorized to approve access and what the process is. This is the foundation for any automation you build later.
- Second, look at your ticket data by application, not just by category. Category-level analysis tells you that Software & Applications is 38.2% of your volume. Application-level analysis tells you which specific tools are generating the most work — and whether the support tax on each one justifies the investment.
For the full ticket mix breakdown by category, use case, and company size, download Fixify's 2026 IT Help Desk Benchmark Report at fixify.com/it-help-desk-benchmark-report-2026.
Related articles


What is IT automation in 2025 and where is it headed?
.avif)
AI in ITSM: The honest challenges Fixify has seen
Stay in the loop

Sign up to get notified about our latest news and blogs