%201.avif)
.svg)
How do I reduce IT ticket resolution time?

Listen to this blog as a podcast

.avif)
Start by identifying which tickets actually need to be fast. Not all help desk tickets are equal. Some are routine requests. Others represent an employee who can't do their job. According to Fixify's 2026 IT Help Desk Benchmark Report, based on 50,000+ tickets across 30+ organizations over 14 months, 22% of all help desk tickets are productivity-blocking. That means for every 100 tickets your team receives, roughly 22 represent someone sitting idle. Reducing resolution time starts with knowing which tickets those are and treating them differently.
More than 1 in 5 tickets is a work stoppage
22% of help desk tickets prevent the employee from doing their job until the issue is resolved.
The distinction between a routine request and a work stoppage is the single most useful classification you can add to your ticket data. An employee requesting access to a new app is a routine request. They can keep working while they wait. An employee locked out of their computer or unable to connect to the VPN is a work stoppage. They're dead in the water until IT resolves it.
Across the benchmark dataset, 22% of tickets fall into the second category. That's not a small number. If your help desk processes 500 tickets a month, roughly 110 of them represent employees who are fully or partially unable to work. And the cost isn't just IT's time. It's the employee's lost output, the downstream delays on whatever they’re working on, and the compounding frustration that comes from not being able to make progress on work that matters.
Three use cases drive two-thirds of all work stoppages
Permissions management (28%), login troubleshooting (22%), and application troubleshooting (16%) account for 66% of productivity-blocking tickets.
The concentration here is an opportunity. You don't need to overhaul your entire help desk to move the needle on work stoppages. You just need to get faster at these three things:
- Permissions management is the single biggest driver at 28% of all productivity-blocking tickets. An employee has access to the right application but the wrong permissions — they can log in, but can't do what they need to do.
- Login troubleshooting is second at 22% — account lockouts, password failures, SSO issues.
- Application troubleshooting rounds out the top three at 16% — the app is accessible but broken or misconfigured.
These three use cases alone represent two-thirds of all work stoppages. They're also structurally well-suited to automation: they're high-volume, they follow repeatable diagnostic paths, and most of them can be resolved without physical intervention.
The productivity-blocking rate climbs with company size
At enterprise scale (1,000+ employees), nearly 1 in 3 tickets is a work stoppage.
The overall 22% rate is a useful benchmark, but it varies significantly by company size. Small companies (under 100 employees) sit at 12.5%. Their ticket mix is dominated by collaboration and onboarding requests, which are largely administrative. Growth-stage companies (100-499 employees) are at 21.6%, roughly in line with the average.
The jump happens when you cross the 1000 employee threshold. Organizations with 1,000+ employees show a 32.5% productivity-blocking rate — nearly one in three tickets. The cause is structural: larger organizations have more complex identity management environments, more applications, and more ways for access and configuration to break. The help desk at enterprise scale increasingly absorbs the problems that genuinely block people from working.
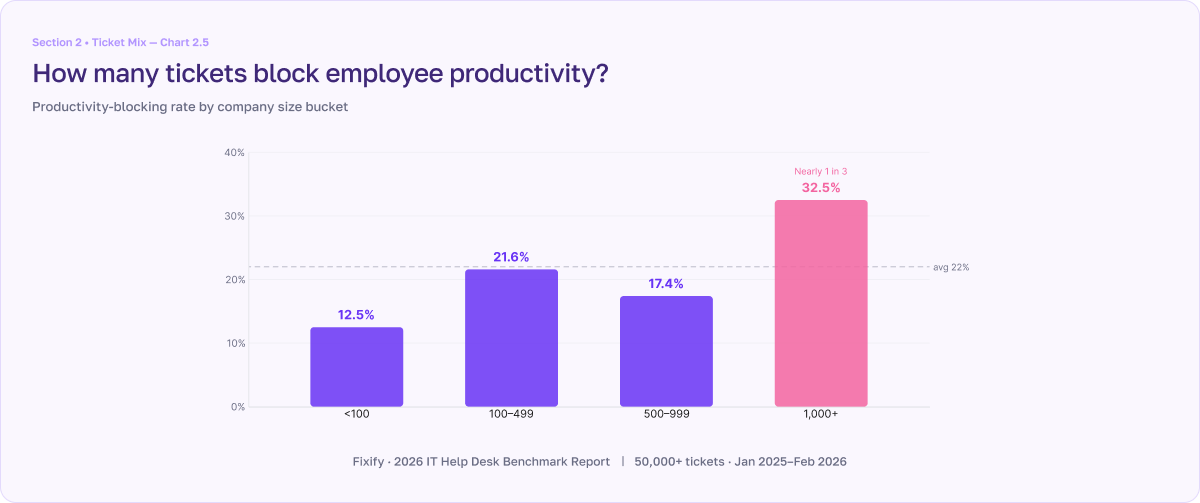
One note on the data: companies with 500-999 employees show a lower rate (17.4%) than the 100-499 range. This is a composition effect — the 500-999 segment is dominated by organizations whose ticket mix skews heavily toward app assignment, which is a routine request rather than a work stoppage. Adjusting for that, the upward trend is consistent.
Frustrated users and work stoppages go hand in hand
Productivity-blocking tickets arrive with 21% negative sentiment — 5x the rate of non-blocking tickets.
When employees can't work, they tell you about it. The negative sentiment rate on productivity-blocking tickets is 21%, compared to just 4% for non-blocking tickets. That's a 5x gap, and it makes sense. A request for a new app carries no emotional charge. Being locked out of your computer with a deadline looming does.
This is where the employee experience dimension meets the operational one. Research on employee engagement consistently shows that the single most important factor in workplace satisfaction is the ability to make daily progress on meaningful work. Productivity-blocking IT issues are a direct obstruction to that progress, which is why they arrive with outsized frustration and why resolving them quickly has a disproportionate impact on how employees perceive IT.
The resolution gap is where the business case lives
With AI automation, median resolution is 4.4 hours. Without it, 71 hours. For productivity-blocking tickets, that's the difference between a same-day fix and days of idle time.
The benchmark data shows a 16x gap in resolution time between tickets resolved with AI automation (4.4 hours median) and those resolved without it (71 hours). For the identity and access tickets that drive most work stoppages, the numbers are even more striking: identity and access management (IAM) tickets resolve in 2.9 hours with automation versus 65.7 hours without. Connectivity tickets: 3.4 hours versus 56.2 hours.
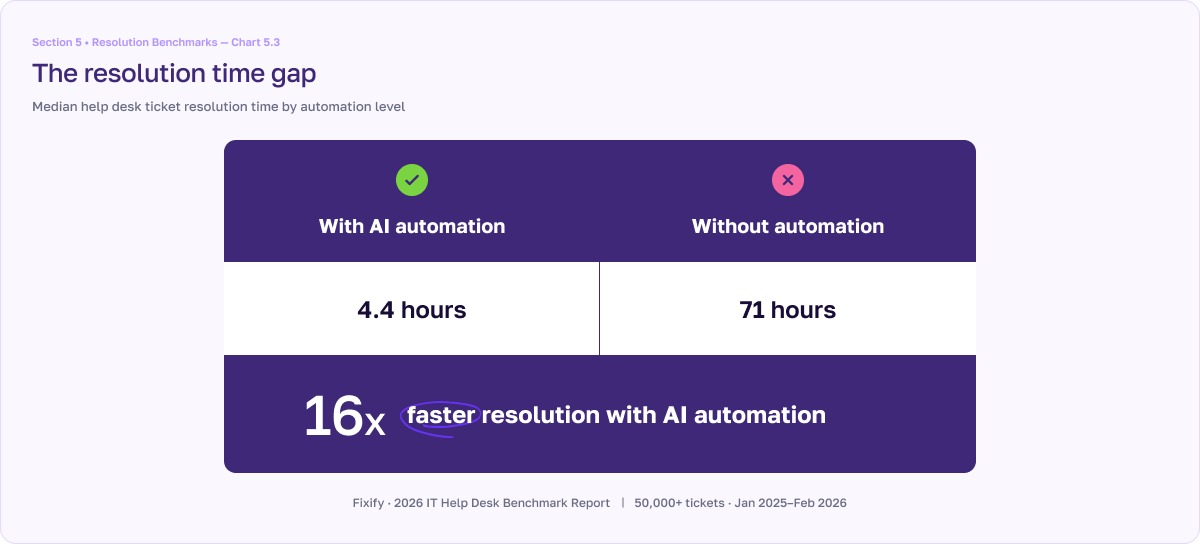
For the 22% of tickets that are productivity-blocking, this gap translates directly into employee hours lost. A permissions issue resolved in 3 hours means a brief interruption. The same issue resolved in 3 days means an employee has been working around the problem — or not working at all — for the better part of a week.
How to identify and fast-track your work stoppages
Reducing resolution time across the board is a fine goal, but it's unfocused. The higher-leverage move is to identify which tickets block employee productivity and treat them as a separate class.
- Classify tickets by impact, not just category. The report identifies 10 use cases across 5 categories that qualify as productivity-blocking — from login troubleshooting and permissions management, to network troubleshooting and VPN issues. Map your own ticket data against a similar framework. The question for each use case is simple: can the employee keep working while they wait, or are they stopped?
- Set tighter SLAs for productivity-blocking tickets. A single SLA for all tickets doesn't reflect the reality that a locked account and a new app request have fundamentally different urgency profiles. Build priority tiers around the distinction.
- Measure the cost in employee hours, not just IT throughput. Your team's average resolution time is an operational metric. The hours your employees spend unable to work because of IT issues is a business metric. The second number is what gets attention in budget conversations.
For the full productivity-blocking data by use case, company size, and automation level, download Fixify's 2026 IT Help Desk Benchmark Report at fixify.com/it-help-desk-benchmark-report-2026.
Related articles

What Is an IT help desk? How It supports IT operations


What it takes to build a 24x7x365 help desk


IT terminology for beginners: A Fixify-friendly glossary
Stay in the loop

Sign up to get notified about our latest news and blogs