.svg)
.svg)
What are good IT help desk benchmarks for my company?

Listen to this blog as a podcast

.avif)
The best IT help desk benchmarks are the ones that match your company's architecture, not your industry’s average. According to Fixify's 2026 IT Help Desk Benchmark Report, based on 50,000+ tickets across 30+ organizations over 14 months, it’s normal for 35% of IT tickets at a healthcare organization to stop work in its tracks (e.g. account lockouts). A cybersecurity firm at the same rate would be a serious outlier — their typical rate is 11.4%. Context is king. And benchmarking without context can lead you to solve problems you don't actually have while ignoring the ones you do.
Company architecture predicts your benchmarks better than any industry label
A 150-year-old insurance company in New York and a 10-year-old insurer in California with a remote workforce are both "insurance companies" — but their IT looks nothing alike.
There's a common instinct in IT benchmarking: find companies in your industry and compare yourself to them. It feels logical. But the data tells a different story. A 150-year-old manufacturing company and a 150-year-old insurance company — both centralized, both legacy-heavy — tend to look more similar to each other than either looks to a younger company in the same industry.
What actually predicts your help desk profile is how your company is “shaped”: how big you are, how fast you're growing, how distributed your workforce is, and how long your organization has been operating at its current shape. Industry matters, but it's one variable among several, and often not the strongest one.
The benchmark data backs this up across every dimension. Remote work percentage, for example, drives identity and access management (IAM) ticket volume from 8.6% at organizations where most people work in the office to 17.9% at fully distributed ones. That gradient is more predictive than any single industry label.
Company size is the single biggest variable
Productivity-blocking rates range from 12.5% at small companies to 32.5% at enterprise level. Negative sentiment triples.
Of all the variables in the dataset, size plays the biggest role in shaping help desk demand. The ticket mix, the frustration level, and the complexity all scale with headcount.
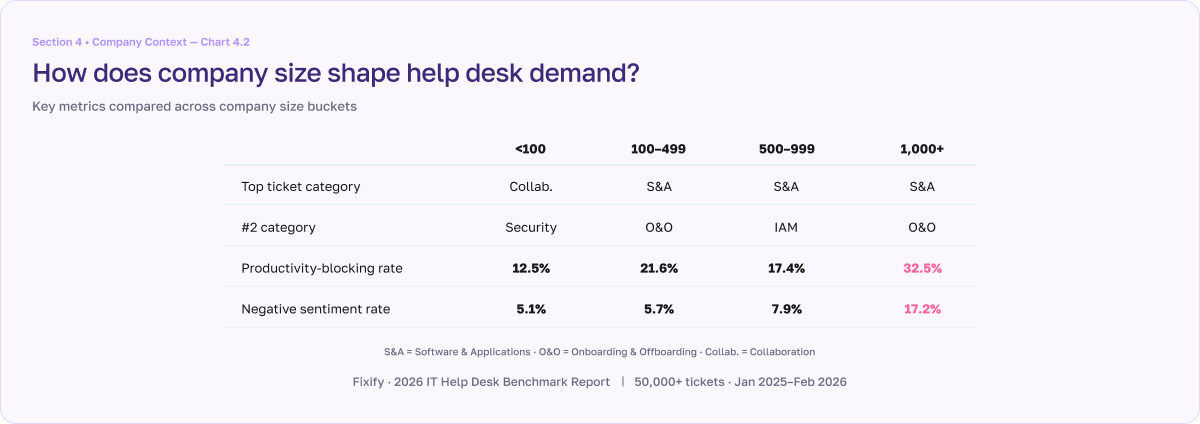
Small companies (under 100 employees) show a 12.5% productivity-blocking rate and 5.1% negative sentiment. Their ticket mix is dominated by collaboration and security. Meanwhile, growth-stage companies (100-499) are close to the overall average at 21.6% productivity-blocking and 5.7% negative sentiment. Onboarding & offboarding surges to second place as they add people.
The jump at enterprise scale is pronounced. Organizations with 1,000+ employees hit 32.5% productivity-blocking — nearly one in three tickets creates a work stoppage. Negative sentiment reaches 17.2%, more than triple the small-company rate. At scale, the help desk absorbs the problems that genuinely block people from working, and those problems come with emotion attached.
If you're a 200-person company benchmarking against enterprise metrics, you'll think you're outperforming. If you're an enterprise benchmarking against the aggregate, you'll think you're failing. Neither is true. You're just in different contexts.
Growth rate shapes your benchmarks as much as size does
Fast-growing companies show a 30.5% productivity-blocking rate and 12.5% negative sentiment. Meanwhile, companies with flat growth show 13.3% and 6.8% respectively.
How fast you're growing is sometimes more predictive than how big you are. Fast-growth companies — those with greater than 20% employee growth — show a 30.5% productivity-blocking rate and 12.5% negative sentiment. Rapid headcount expansion puts sustained pressure on identity management, access provisioning, and hardware deployment. Everything is moving, and the help desk feels it.
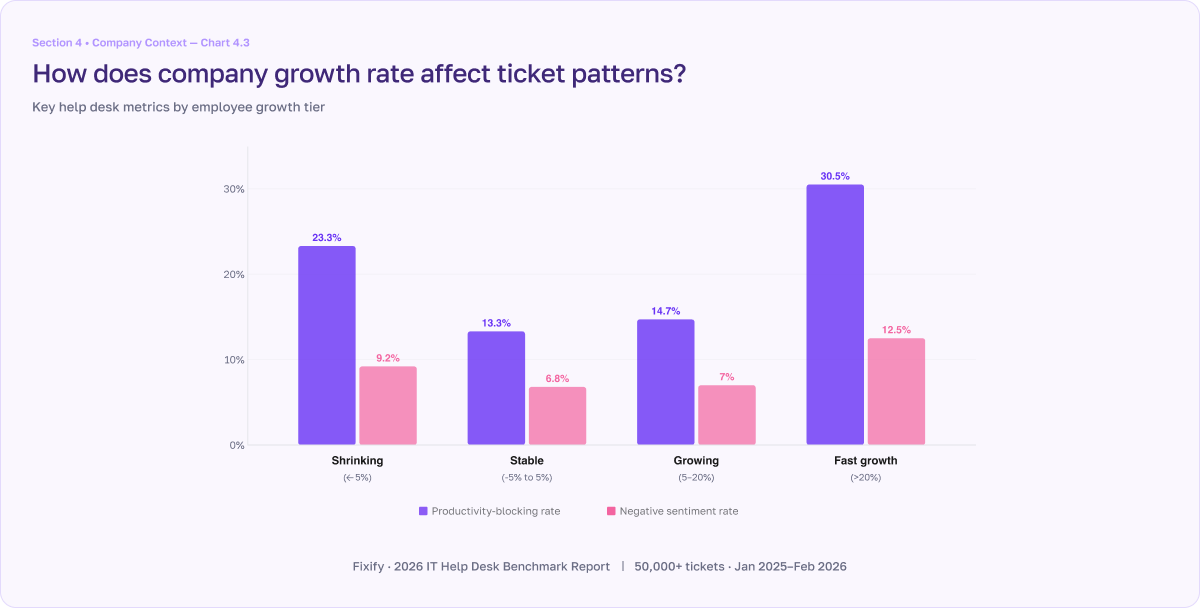
Stable companies (-5% to 5% growth) show the best overall profile: 13.3% productivity-blocking, 6.8% negative sentiment, and the lowest onboarding burden at 7.6%. These organizations have established routines and manageable ticket loads.
One unexpected finding: shrinking companies still show elevated productivity-blocking rates at 23.3% and meaningful onboarding/offboarding volume at 17.6%. Workforce transitions in either direction — hiring or downsizing — generate help desk volume. The quiet period is stability, not contraction.
Growing companies in the 5-20% range carry the highest onboarding share at 26.7%. They're hiring actively but may not yet have automated provisioning workflows to absorb the volume. If you're in this range, investing in lifecycle automation now pays off before you cross into fast-growth territory.
Industry benchmarks are useful — but only directionally
Healthcare organizations have a 35.3% productivity-blocking ticket rate, compared to 11.4% in cybersecurity and 27.4% negative sentiment in insurance
The industry-level data is genuinely useful as a reference point, but it shouldn't be mistaken for a target.
Healthcare organizations manage large, growing workforces with high turnover and rely on physical devices — clinical workstations, tablets, check-in kiosks. Their ticket mix is dominated by onboarding/offboarding (32.6%) and hardware (14.8%). A 35.3% productivity-blocking rate and 18% negative sentiment are structurally normal for this environment.
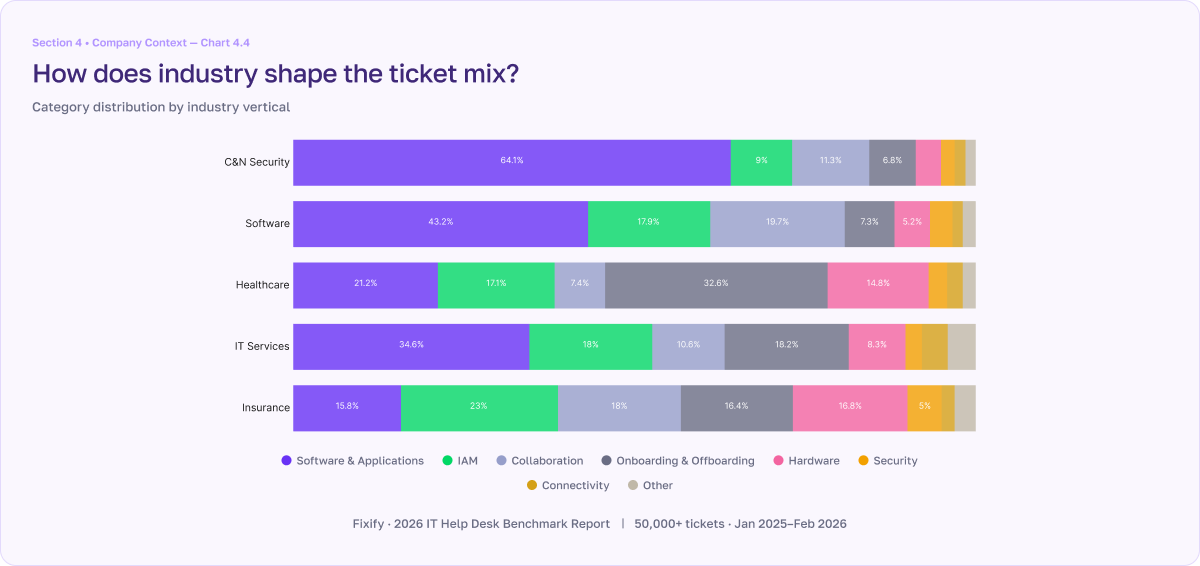
The tickets at cybersecurity companies concentrate overwhelmingly in software & applications (64.1%). Their employees are technically sophisticated, and the ticket mix reflects routine access management rather than troubleshooting. They produce the lowest productivity-blocking rate in the dataset at 11.4%.
Insurance shows the highest negative sentiment at 27.4%, driven by a mix of IAM, hardware, and compliance-related access issues in customer-facing operations where IT failures directly impact external workflows.
These are directional benchmarks, not statistically robust industry profiles. But the patterns are intuitive and consistent — use them as reference points for understanding where your own numbers fit.
More IT staff doesn't automatically mean better outcomes
The median is 2.0 IT staff per 100 employees — but the correlation with ticket volume is weak (r = 0.21).
The most common staffing question in IT planning is "Do we have enough people?" The dataset offers a reference range: the median is 2.0 IT and security staff per 100 employees, with a practical range of 0.7 to 4.3. The ratio declines with company size — from 2.2% at companies under 100 employees to 1.2% at 1,000+, reflecting economies of scale.
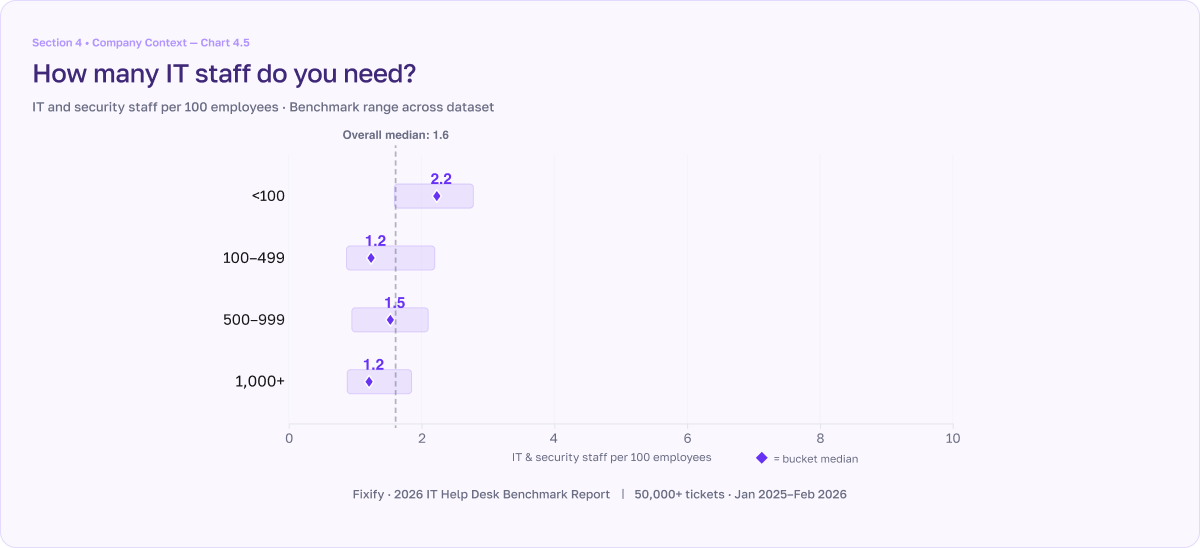
But here's the finding that challenges the assumption behind the question: the correlation between IT staffing ratio and ticket volume is weak at r = 0.21. Correlations with sentiment and productivity-blocking rates are negligible. Both are better explained by industry type and company complexity than by how many people are on the IT team.
More staff doesn't automatically mean fewer tickets or faster resolution. How you deploy resources — what you automate, which tickets you prioritize, how you structure your workflows — matters more than headcount.
How to find your peer group
Stop benchmarking against the aggregate. Instead, identify 2-3 attributes that define your company architecture. Start with these three, which are the strongest predictors in the dataset:
- Number of employees
- Growth rate
- Percent of employees working remotely
Find the matching segments in the report and use those as your baseline.
If you're well outside the range for your peer group, it's worth investigating. If you're inside it, your help desk is performing normally for your context. In that case, the question shifts from "Are we underperforming?" to "Where within our peer group can we get better?"
For the full benchmarks broken down by industry, company size, growth rate, and remote work percentage, download Fixify's 2026 IT Help Desk Benchmark Report at fixify.com/it-help-desk-benchmark-report-2026.
Related articles
.jpg)
Fixify benchmark report: How does your IT help desk measure up?
Fixify Service Catalog: The heat map that shows what IT really does all day


The best help desk software of 2026: How to choose the right solution for your team
Stay in the loop

Sign up to get notified about our latest news and blogs