.svg)
.svg)
Which IT applications generate the most help desk tickets?

Listen to this blog as a podcast

.avif)
Okta generates the most help desk tickets by a wide margin. According to Fixify's 2026 IT Help Desk Benchmark Report, based on 50,000+ tickets across 30+ organizations over 14 months, Okta appears in 12.8% of all app-tagged tickets, roughly 2x the volume of the next most common application. But the app that generates the most tickets isn't the app your employees hate dealing with most. That distinction belongs to OneDrive, where 39% of tickets arrive with negative sentiment. Volume and frustration tell very different stories — and IT leaders need both.
Okta generates the most tickets — by a wide margin
Okta accounts for 12.8% of all app-related tickets. Salesforce is a distant second at 6.7%.
The list reads like a modern enterprise stack. Okta is perched at the top with 12.8%, which makes sense given the central role identity management plays in SaaS-heavy environments. Every access request, every SSO issue, every MFA problem routes through the identity provider. Salesforce is a fast follower, generating 6.7% of app-related tickets. The key drivers here are simply the sheer complexity of CRM access management: licensing tiers, field-level permissions, dashboard access, and sub-component provisioning, you name it. After Salesforce come the productivity applications. Slack (5.1%), Microsoft 365 (4.5%), and GitHub (2.9%) round out the top five.
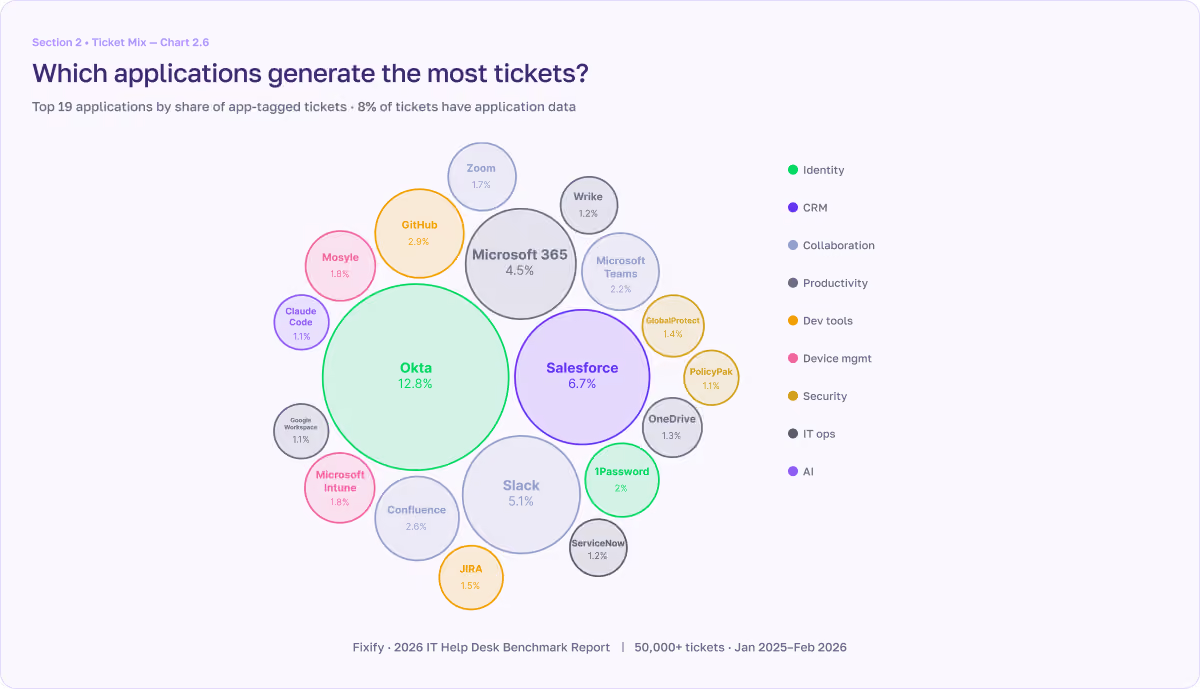
There are 483 distinct applications that appear in the data set. That’s nearly 500 different tools generating support requests. And app diversity scales along with a company’s size. Organizations with less than 100 employees average about 5 distinct apps in their ticket data. This is likely because users know who owns each app and they go directly to the app owner when issues pop up instead of filing a help desk ticket. Meanwhile, at organizations with more than 1,000 employees, the average number of apps showing up in the tickets jumps to 63. Every one of those tools carries a support tax, and IT absorbs it whether they chose the tool or not.
Volume and frustration are two different lists
OneDrive leads negative sentiment at 39%. Outlook is at 37%. PolicyPak at 31%. GlobalProtect at 26%.
The apps that generate the most tickets are identity and productivity tools — high-volume because everyone uses them, not necessarily because they're painful. The apps that generate the most frustration are a different set entirely: file sync, email, security enforcement, and VPN.
When OneDrive won't sync a file, Outlook stops sending email, a security policy blocks something you need to do, or your VPN drops mid-meeting, you feel it immediately. These apps create interruptions that stop work in its tracks. That's why they arrive with 26-39% negative sentiment while tools like Okta and Slack sit well below 10%.
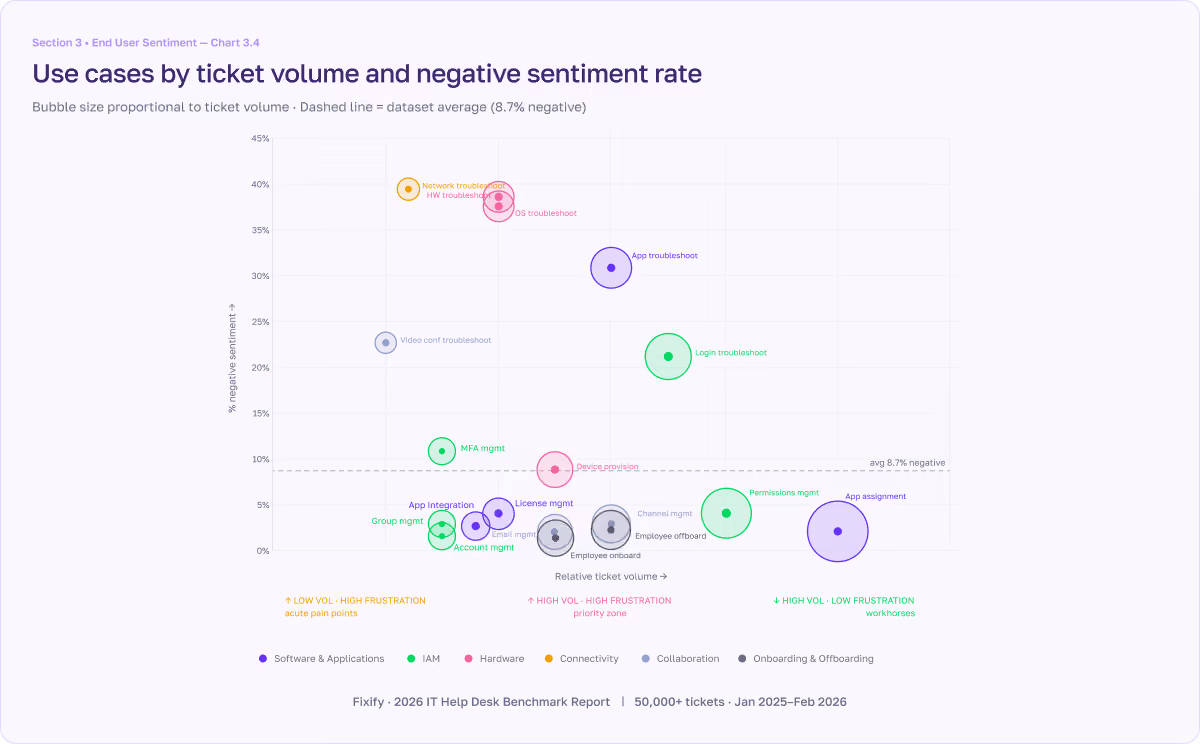
At the use case level, the pattern holds. Network troubleshooting carries 39.3% negative sentiment. Hardware troubleshooting: 38.4%. OS troubleshooting: 37.4%. Application troubleshooting: 30.7%. The common thread is disruption — when a tool that was working five minutes ago suddenly isn't, the ticket comes in hot.
On the other end of the spectrum, AI tools and password managers skew notably positive. Tickets for tools like Claude Code, ChatGPT Enterprise, and 1Password are overwhelmingly access provisioning requests where employees are asking for something new rather than complaining about something broken.
As AI tool deployments expand, expect the volume to grow and the sentiment mix to eventually shift as users begin encountering configuration and integration issues.
483 distinct applications — and IT doesn't own most of them
In many organizations, software purchasing decisions are made by individual departments — IT inherits the support responsibility for applications it had no role in selecting.
Here's the structural issue behind the numbers: IT typically doesn't choose the applications it supports. Different departments decide to adopt a new CRM, a new project management tool, a new design platform. IT gets the job of provisioning access, managing licenses, troubleshooting issues, and handling offboarding — for a tool someone else selected, someone else configured, and often no one clearly owns.
The result is that IT absorbs both the support cost and the decision-making around how to support each tool. When there's no clear application owner, IT becomes the default. And when that application generates tickets, there's no one on the business side accountable for the volume it creates.
Given how distributed SaaS app purchases are across most organizations, the IT help desk often provides one of the best lenses into the state of shadow IT. That’s because desk tickets are an unintentional discovery mechanism for unapproved tools. When employees start submitting access requests for apps that haven't been greenlit (or IT doesn’t know about), the help desk is often the first to know, sometimes before security, procurement, or whoever should be making that decision.
How to use this data
Most IT teams analyze their tickets by category — how many password resets, how many hardware issues. That's useful, but it's incomplete. Analyzing tickets by application reveals a different layer: the actual support tax each tool imposes on your team.
- Calculate the support cost per application. For your top 10 applications by ticket volume, break down the ticket types: access requests, licensing, troubleshooting, and configuration. That gives you a per-app support profile and a number you can take into vendor renewal conversations. If you're paying for platinum support from a vendor and still handling most of the load internally, that's worth renegotiating.
- Use ticket data to identify shadow IT. If employees are submitting access requests for tools you haven't approved, your help desk is already doing shadow IT discovery. Formalize it. A regular review of application-level ticket data can surface unapproved tools before they become entrenched.
- Prioritize automation where volume meets frustration. The highest-leverage automation targets aren't just the highest-volume apps — they're the apps that combine meaningful volume with elevated frustration. Identity tools like Okta generate the most tickets. File sync and connectivity tools generate the most frustration. The intersection of those two signals is where automation investment pays off fastest.
For the full application-level ticket data and sentiment analysis, download Fixify's 2026 IT Help Desk Benchmark Report at fixify.com/it-help-desk-benchmark-report-2026.
Related articles
The art of choosing tech for your startup: Build, buy, or use open source

A quick offboarding checklist for tech companies

Scaling up Okta Workflows: What IT teams learn after the first 10 flows

Stay in the loop

Sign up to get notified about our latest news and blogs