%201.avif)
.svg)
How do I improve IT help desk performance?


Listen to this blog as a podcast

.avif)
How do I improve IT help desk performance?
According to Fixify's 2026 IT Help Desk Benchmark Report, based on 50,000+ tickets across 30+ organizations over 14 months, most IT help desks aren't underperforming because of the wrong people or the wrong tools. They're underperforming because staffing, SLAs, and automation investments aren't aligned to the patterns in their own ticket data. Here are the five highest-impact adjustments the data supports.
1. Staff for Tuesday mornings and the summer surge
Tuesday carries 23.5% of weekly ticket volume and July runs 29% above average — weight your coverage accordingly.
Monday gets the reputation, but Tuesday gets the tickets. In the benchmark data, Tuesday accounts for 23.5% of all weekly ticket volume, making it the busiest day of the week. Together, Monday and Tuesday carry 45% of the entire week's demand. Part of the Tuesday spike is a delayed effect: employees discover a problem Monday, try to self-resolve, and file the ticket Tuesday morning when they hit a wall and give up. By Friday, volume drops 30% below the Monday-through-Thursday average.
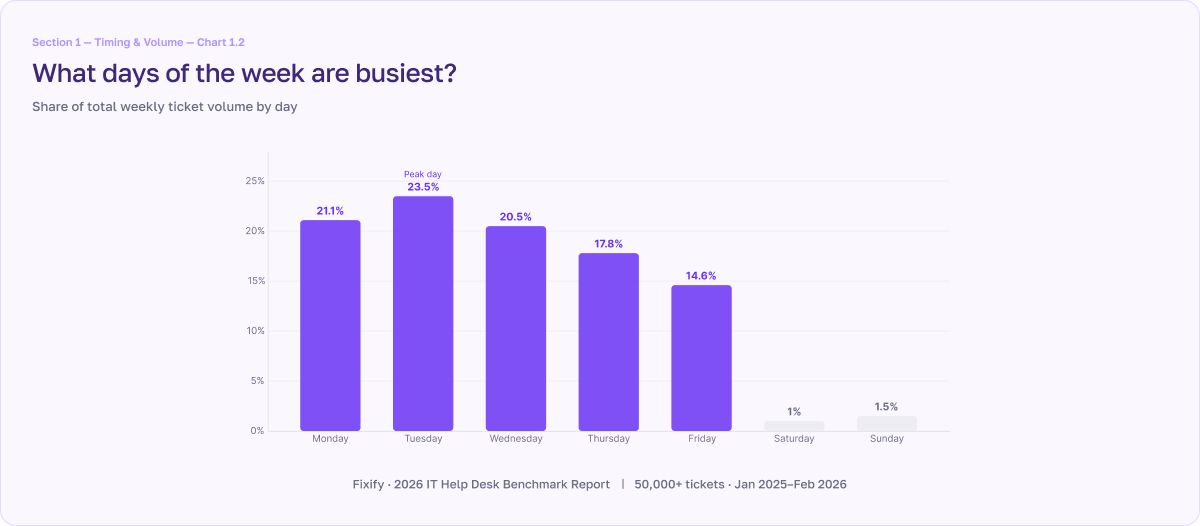
The seasonal pattern is just as clear. July runs 29% above the average month, driven by summer onboarding and mid-year access reviews. February and March are the quietest stretches at 20–24% below average.
What IT leaders should do next: Match your capacity to demand by front-loading analyst coverage toward early-week mornings. For example, if you’ve got a 10am Monday team sync meeting you might want to rethink it. It pulls your people out of the queue at exactly the moment demand is highest. Move recurring meetings to Friday afternoons, when volume is lightest.
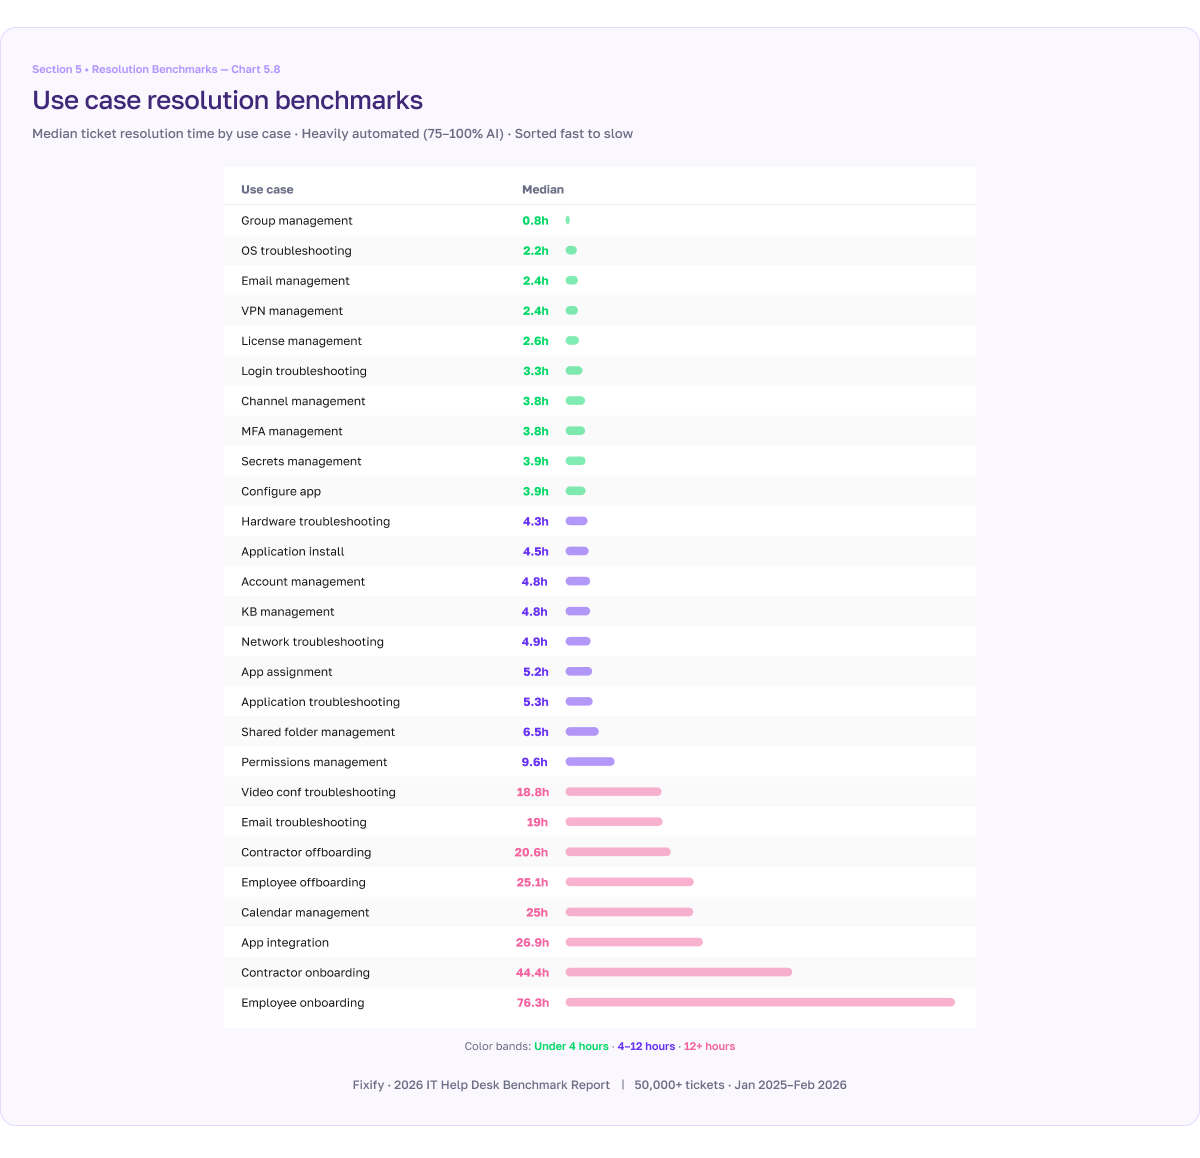
2. Build category-specific resolution SLAs
A single SLA across all ticket types hides more than it reveals. Identity-related tickets resolve in 3-4 hours with automation, while onboarding workflows take 25-75+ hours on average.
A blanket service level agreement (SLA) like "resolve 80% of tickets within 24 hours" treats an account lockout and onboarding a new employee as equivalents. But they aren't. IAM and connectivity tickets resolve in 3-4 hours when agents are assisted with AI automation. Hardware and collaboration issues take 3-5 hours. Onboarding and offboarding workflows take 25-75+ hours because they involve multi-step approvals, vendor coordination, and dependencies that can't be compressed.
Category-specific SLAs give you an honest picture of where you're succeeding, where you need to invest, and where a slow resolution is structural rather than a performance failure.
What IT leaders should do next: Find the most relevant benchmarks for your use cases and set your SLAs accordingly.
3. Target the 15-minute-to-4-hour resolution window to convert frustrated users
93-97% of frustrated users become satisfied when resolved in this window, and more than one third of users turn actively positive.
A CIO once told me: "If people are happy, no one will look at the numbers. And if people are unhappy, no numbers will save me." The benchmark data backs him up, and it also shows where IT teams can move the needle.
When frustrated users get a resolution within 4 hours, 93-97% leave satisfied. In the 15-minute-to-1-hour band, 37% become actively positive. After 3 days, the conversion rate drops to 68%.
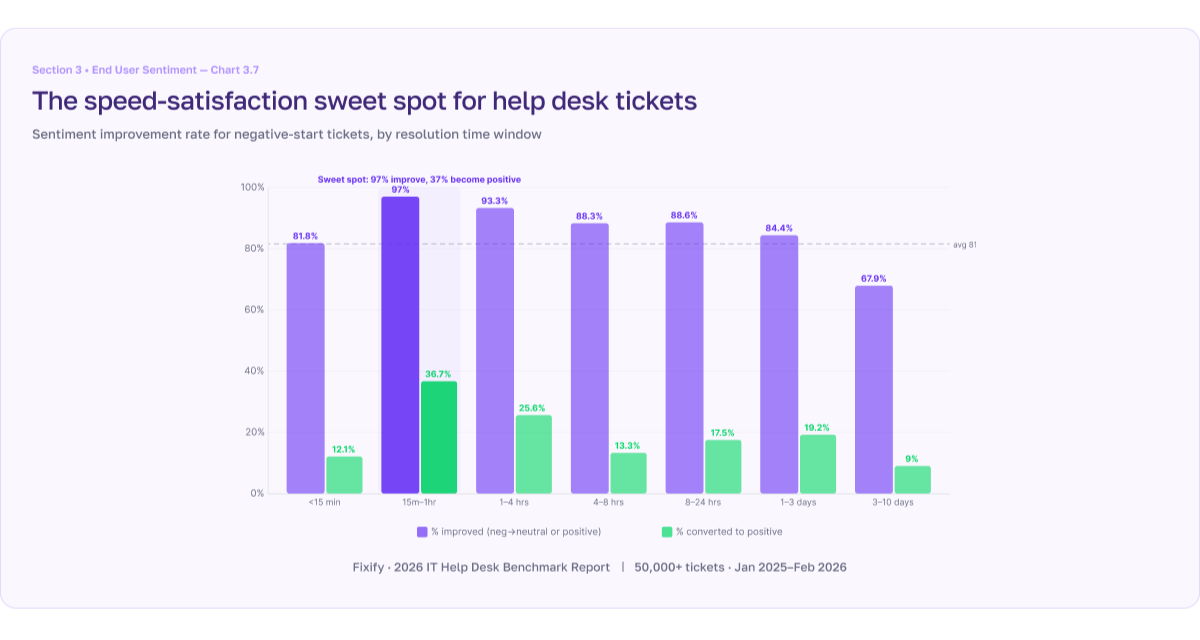
What IT leaders should do next: Hardware and connectivity tickets deserve priority here. One in four hardware tickets arrives with negative sentiment — roughly 3x the average — yet they convert at 80%+ when resolved. The frustration is acute but fixable. Fast-tracking these categories is the highest-leverage intervention for moving satisfaction numbers.
4. Add automation to improve resolution time, not response time
First response is 5 minutes with or without automation — the 16x gap is entirely in resolution time (4.4 hours vs. 71 hours).
The median first response time in the benchmark data is 5 minutes. It’s virtually identical whether or not AI automation is involved. Automation doesn't make triage faster.
What it does change is everything that happens after triage.
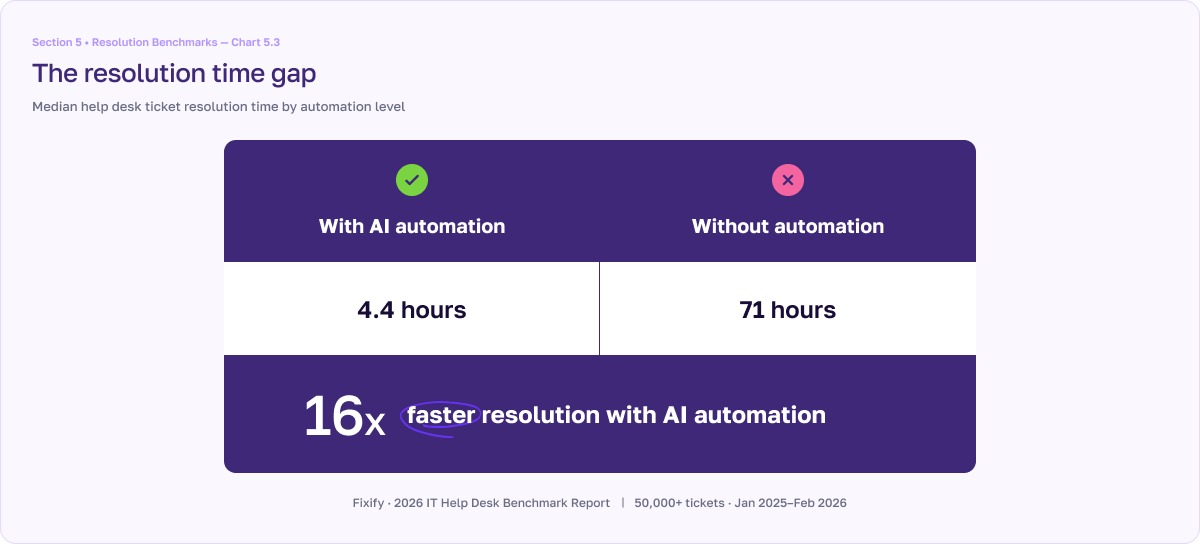
Tickets resolved with AI automation close in a median of 4.4 hours. Without automation, the median is 71 hours — nearly three full business days. That's a 16x gap. Much of it comes from cutting the dead time between handoffs when a ticket is waiting on an approval or some other dependency. Once the blocker clears, automation picks it back up immediately, whereas a human agent has to context-switch back to it — and that latency compounds across every handoff in the ticket's lifecycle.
For the 22% of tickets that are productivity-blocking (e.g. account lockouts and VPN issues), that gap is the difference between a same-day fix and a work stoppage that stretches out to a day or two.
What IT leaders should do next: When you’re evaluating automation ask yourself, "Will this help us resolve faster — and what is slow resolution costing us?"
5. Benchmark against your peer group, not the overall dataset
Industry, size, and growth rate shape your benchmarks more than anything your IT team does.
A 150-year-old insurance company headquartered in a single building in eastern New York and a 10-year-old fully remote insurance company in California are both "insurance companies" but their IT looks nothing alike. The benchmark data confirms this: company architecture — size, age, remote percentage, growth rate — predicts help desk patterns more reliably than any single industry label.
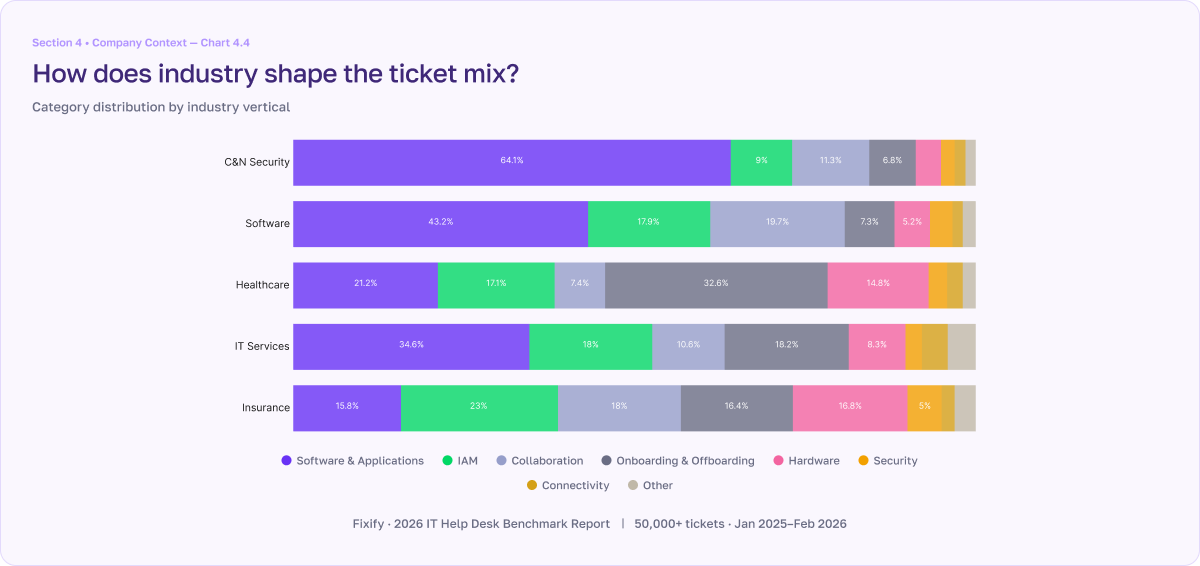
A healthcare organization with 35% of tickets threatening to block employee productivity is running normally. On the other hand, a cybersecurity firm at the same rate would be an outlier, as their typical rate of productivity-blocking tickets is only 11.4%. Fast-growth companies (>20% employee growth) show 30.5% productivity-blocking rates and 12.5% negative sentiment. That doesn’t mean they’re failing — it’s just the cost of scaling.
What IT leaders should do next: The full report breaks down benchmarks by industry, company size, and growth rate among other factors. Find your best comparison and use those benchmarks.
Next steps
These five adjustments don't require new headcount, a platform migration, or a six-month roadmap. They require looking at your own data through the lens of what 50,000+ tickets reveal about where performance actually comes from.
For the full data behind each recommendation, download Fixify's 2026 IT Help Desk Benchmark Report at fixify.com/it-help-desk-benchmark-report-2026.
Related articles

The new IT talent equation: Why AI makes human expertise more valuable

Theodore Roosevelt and ChatGPT


The hybrid help desk: Combining internal IT with AI-powered outsourcing
Stay in the loop

Sign up to get notified about our latest news and blogs